Data Strategy Designkit A0 (47" x 33") synthetic paper (EN)
Why Data Strategy Designkit Canvas?
The Data Strategy Design method helps you to design data-driven business models in interdisciplinary teams. An essential part of the method is the Data Strategy Design Kit, which comprises a collection of visual collaboration tools - so-called canvas templates. The canvas from this toolbox can be used and combined for different purposes and in different ways. To give you an overview of the available tools and to show you how these tools work together, there is the data strategy design kit Canvas. You can also use the Data Strategy Design Kit Canvas to plan your data strategy projects and document the current state of the project.
What is Data Strategy Designkit?
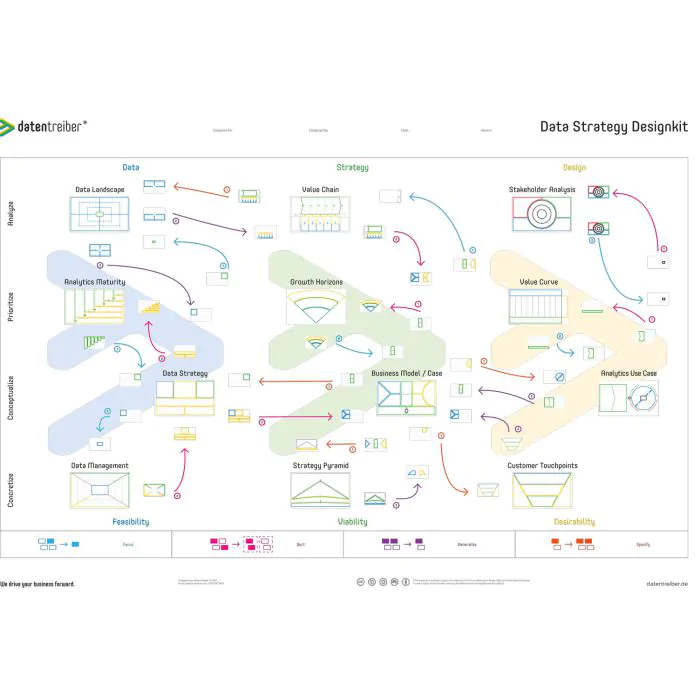
On the Data Strategy Designkit Canvas, you will see all canvas tools for data strategy design as pictograms divided into the three areas of Data Strategy and Design and distinguished according to their primary function (analyze, prioritize, conceptualize and concretize). The three areas stand for the three critical success factors of data-driven innovations.
- Data → Feasibility: it is technically and analytically feasible and in particular we have the necessary data?
- Strategy → Viability: it is economically and financially rewarding?
- Design → Desirability: From the technical and personal point of view of the customer or user it is intended?
Although each canvas can be used for different purposes, they each have a primary function:
- With the Canvas Data Landscape, Value Chain and Stakeholder Analysis, you can analyze the current status with regard to data availability, production and distribution channels or the contact persons and decision makers at your customers.
- The Canvas Analytics Maturity, Growth Horizons and Value Curve help you prioritize your analytics applications, business ideas or value propositions and focus your work on the most promising projects.
- The Canvas Data Strategy, Business Model and Value Proposition form the core of the design kit: they serve to design analytical solutions, data-driven business models and data-based products.
- With the Canvas Data Management, Strategy Pyramid and Customer Touchpoints you concretize your data strategy, business model and value propositions.
How to use Data Strategy Designkit Canvas?
How to start.
Use the Data Strategy Designkit Canvas to plan which tools to use in a data strategy project, when and for what. Datentreiber has developed a Design Guide for typical application scenarios. For data-driven optimization of your company, for example, you start with an analysis of the Business Model to define a critical application area. Then, for example, focus on key channels and use the Customer Toachpoint Canvas to identify potential data-driven use cases for your marketing channels. Next, sort the use cases according to their analytical maturity level using the Analytics Maturity Canvas, etc..
Plan the use of tools.
According to this plan, place red Stattys Notes on or next to the canvas business model, customer touch points and analytics maturity pictograms and number the notes "1st", "2nd" and "3rd". If necessary, add the respective task, i.e. "1. focus on application area", "2. identify use cases" and "3. sort use cases".
Define the current status.
Once you have completed a task, replace the red slip of paper with a green one (with the same label). For tasks that you have already started but not yet completed, use yellow slips of paper. In addition, note the date of the last processing on the notes and transfer critical assumptions, questions and tasks as white notes from the respective canvas to the Data Strategy Designkit Canvas. So you always have a quick overview of what still needs to be done.
Links
You can find more information at Datentreiber.
| SKU | 381-DATR413 |
|---|---|
| brand | Datentreiber |
| Size | 118,9 x 84,1 cm (49" x 33") |
| Material | Synthetic paper 210 g/m² |
| Weight in kg | 0.21 |
| Delivery | We do our best to send within 0-2 days with DHL or Deutsche Post |
| VAT Number in EU | While completing your online order, please make sure you fill in your VAT number, if you have one and the delivery is to an EU-country outside Germany. Otherwise we have to incl. 19 % VAT on your invoice |
| Online offering | Our online offering is targeted for companies, registered business, freelancers and associations as well as authorities, schools and universities. German VAT added to all deliveries in Germany and EU deliveries without valid VAT number. |
| Country of Manufacture | Germany |
| HTS Code | 39219060 |